The research desk, open to everyone.
Company data, news, charts, and AI — without switching between five different tools.
Researching stocks made easier for everyone.
Open the app ↗Open source — view on GitHub
Detailed company research — earnings, margins, what filings actually say — has long been locked behind expensive professional tools. Not because the data was scarce, but because the tools to make sense of it were.
Open Terminal changes that. It combines real SEC Edgar financial data, live market news, company summaries, and an AI you can ask direct questions — no finance background required.
Better information leads to better decisions. That's the idea.
Company data, news, charts, and AI — without switching between five different tools.
Six tools, each built around a question a real investor would actually ask.
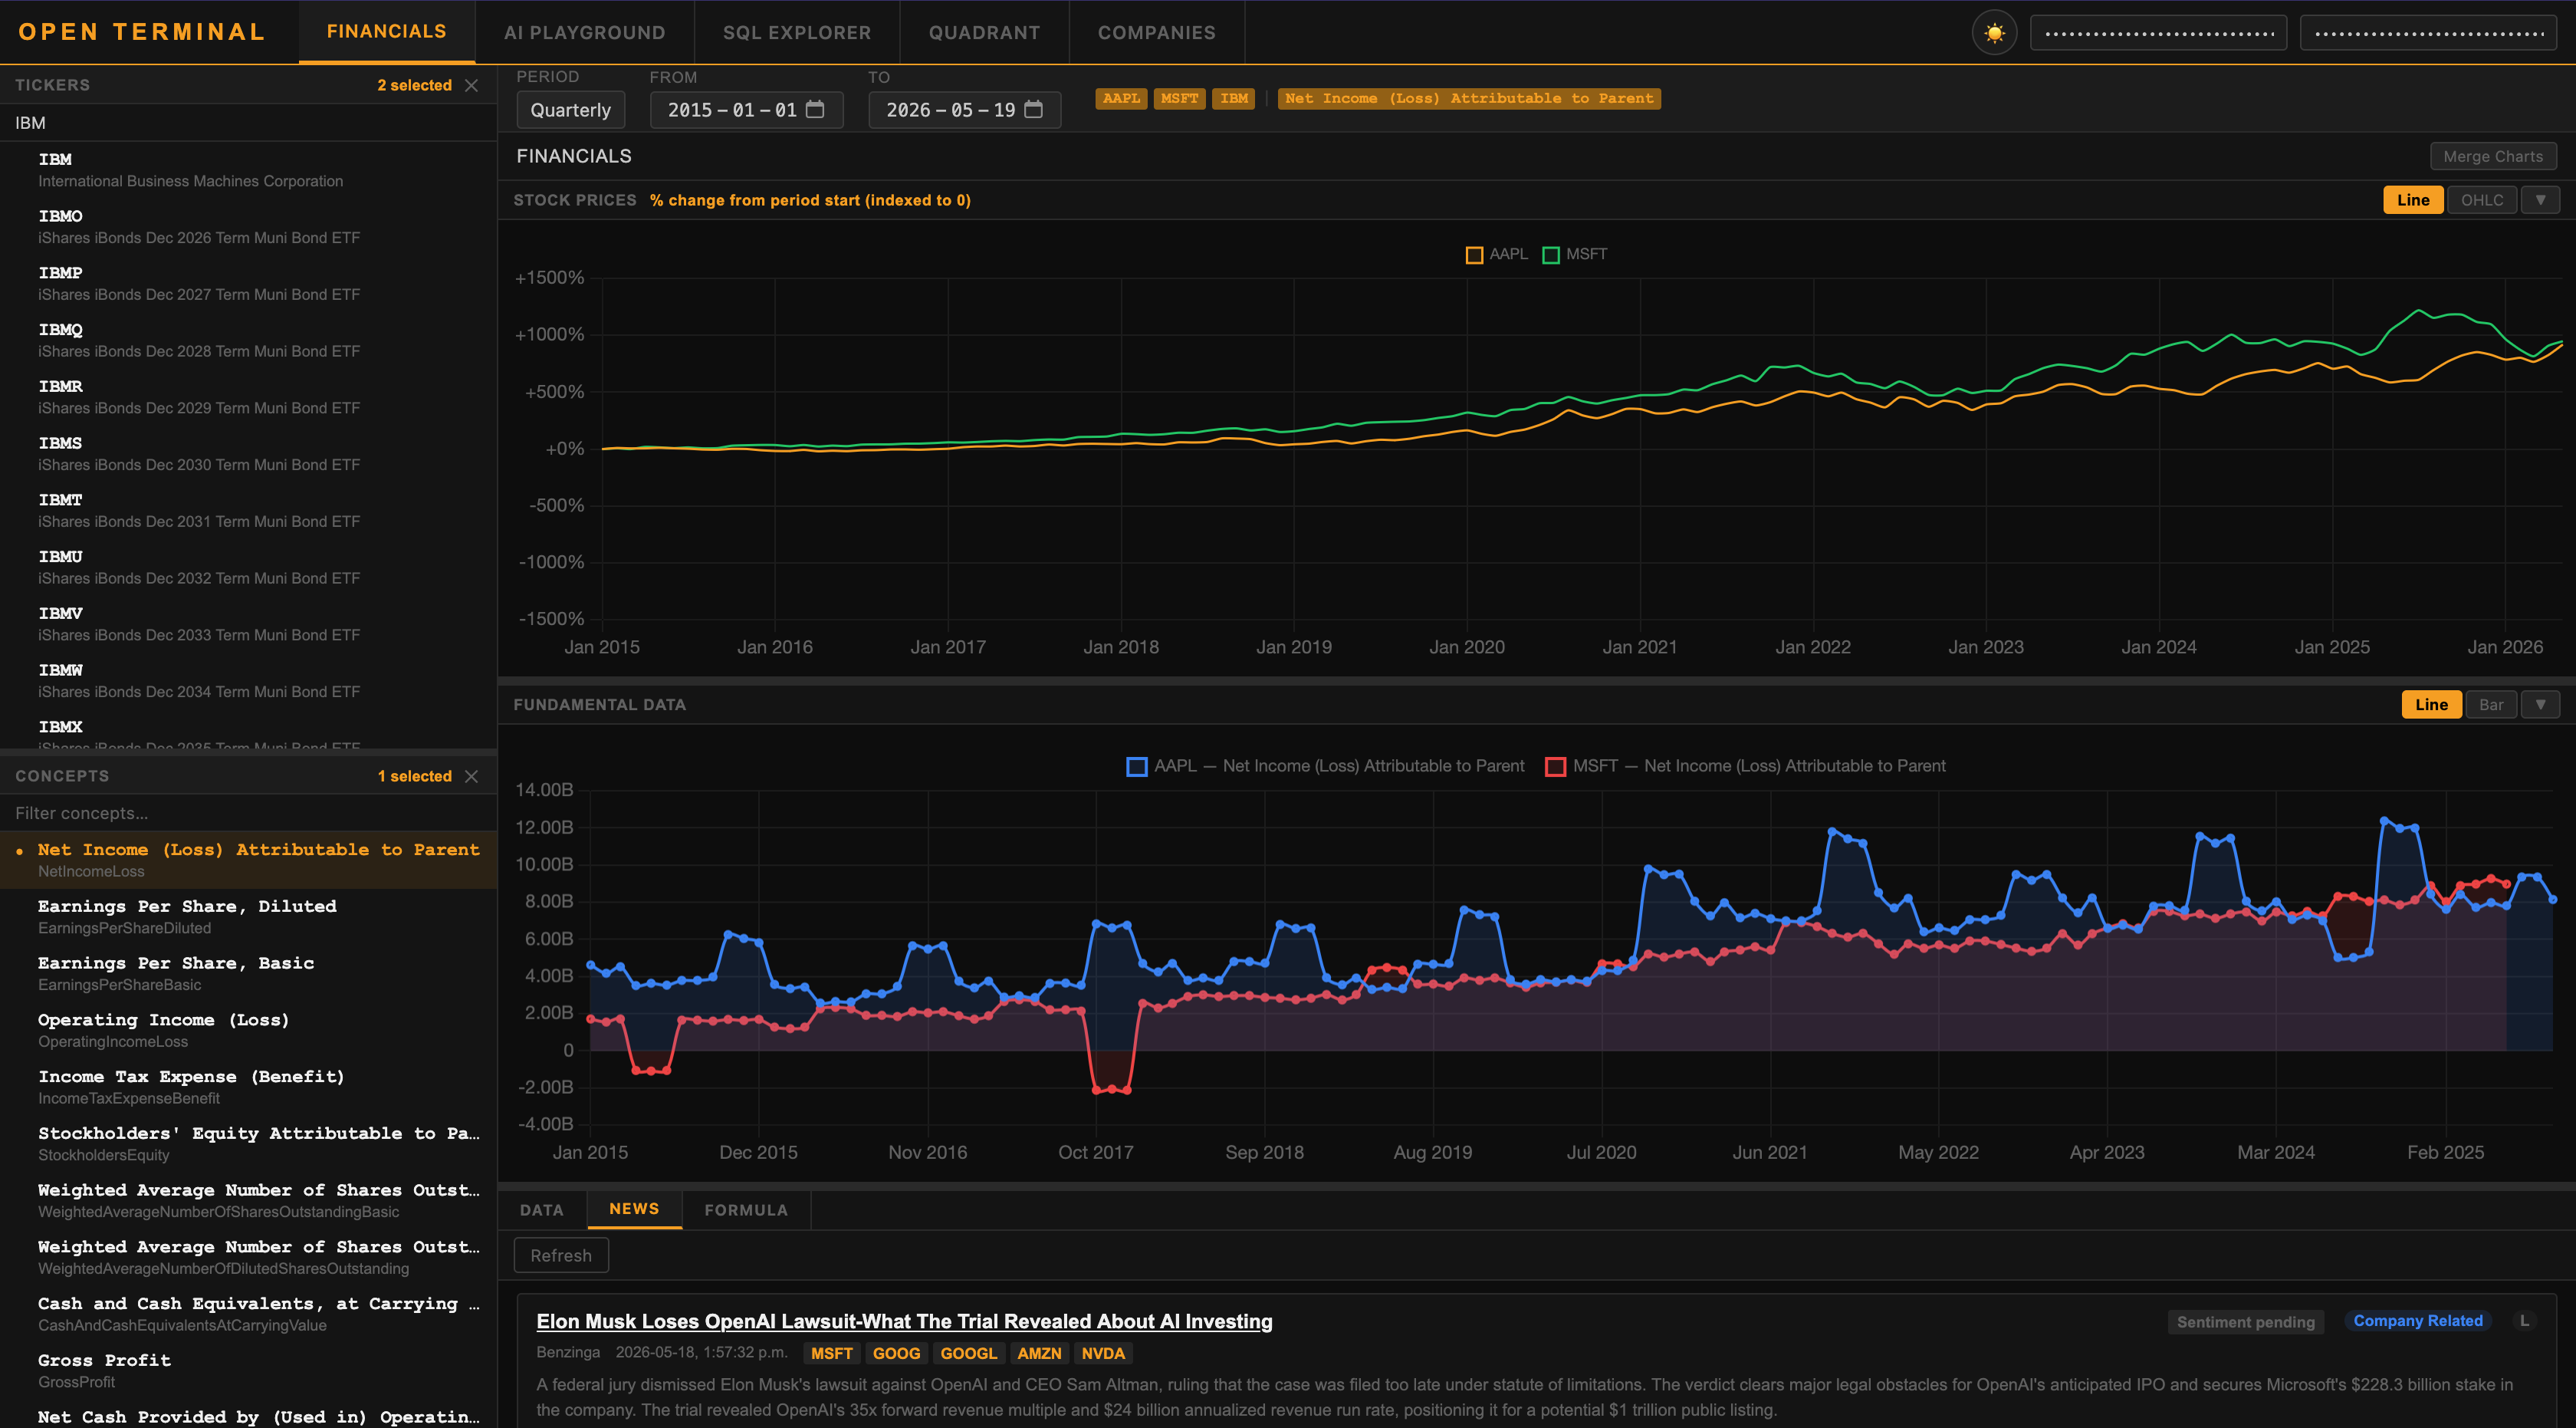
Pull up revenue, operating income, R&D spend, or any other SEC financial metric across the companies you're watching — charted over time, side by side.
Search 10,000+ public companies by name, ticker, or sector. Read plain-English business summaries, browse recent SEC filings, and see related news — all in one place.
Plot any financial formula on X and Y axes across your watchlist. Useful for spotting which companies stand out — or don't — on the metrics that matter to you.
Articles are automatically classified as directly about your stock or just broadly related industry coverage — and scored for sentiment — so you can focus on what's actually relevant.
Type a plain-English question — "which healthcare companies have growing profit margins?" — and get back a chart and a straight answer, without writing a single formula yourself.
For those who want direct access to the underlying data. Write SQL queries against the full financial database and explore whatever angle the other tools don't cover.
Not just traders or analysts — anyone who wants a clearer picture of what they're investing in.
You've been investing for a while but often feel like you're working with incomplete information — relying on news, ratings, and gut instinct more than actual data.
Before you invest in anything, you want to compare options properly — look at actual financials, read what the company says in its own filings, and make a considered decision.
You like working with data directly. You'd rather form your own view from raw financials than rely on someone else's interpretation — you just need the tools to make that practical.

Alex is the founder of Tesseract Analytics. He built Open Terminal after years of finding it harder than it should be to access straightforward financial data on public companies — data that has always existed, but was rarely presented in a way that was practical for someone without a Bloomberg terminal or a research team.
He has a background in mathematics and built most of his technical skills hands-on. He holds a MicroMasters in Data and Economics from MIT and studied Artificial Intelligence and Technology Management at BCIT.
His goal wasn't to build something for professionals. It was to build something that makes the research process genuinely easier for anyone who takes their investments seriously.